Extra Features
Once you're familiar with the basics of iNZight, you can try out some of the more advanced features.
iNZight Display Mode
iNZight (> 3.0) has two display modes: the traditional all-in-one window, as well as a separate graphics window and a narrow control panel (like VIT).
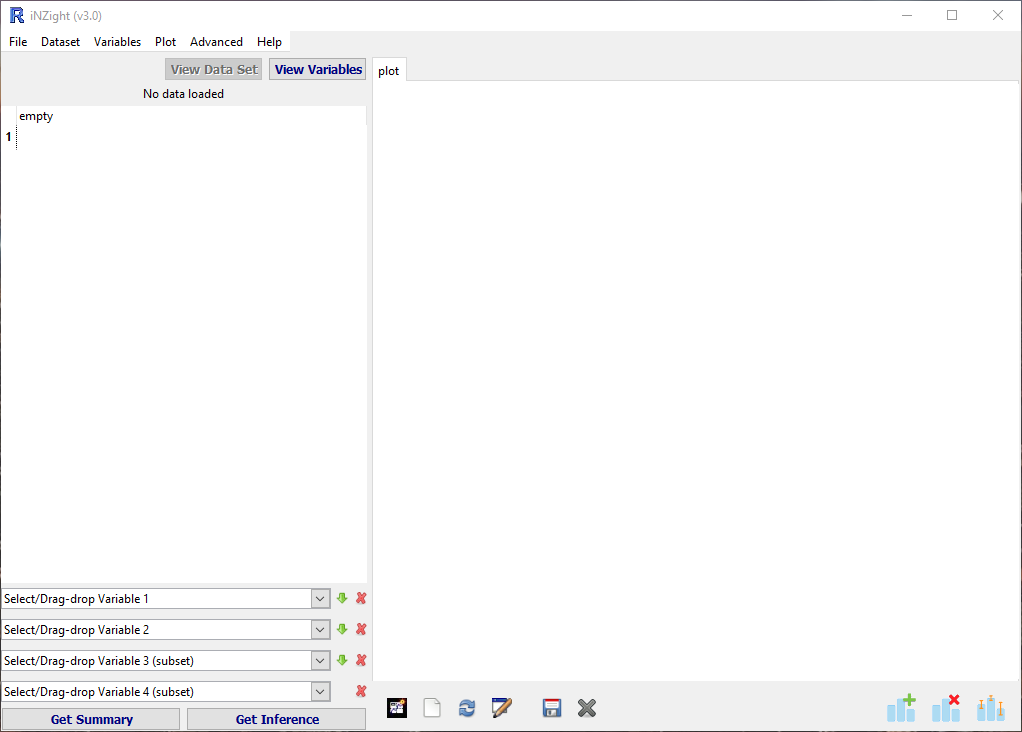
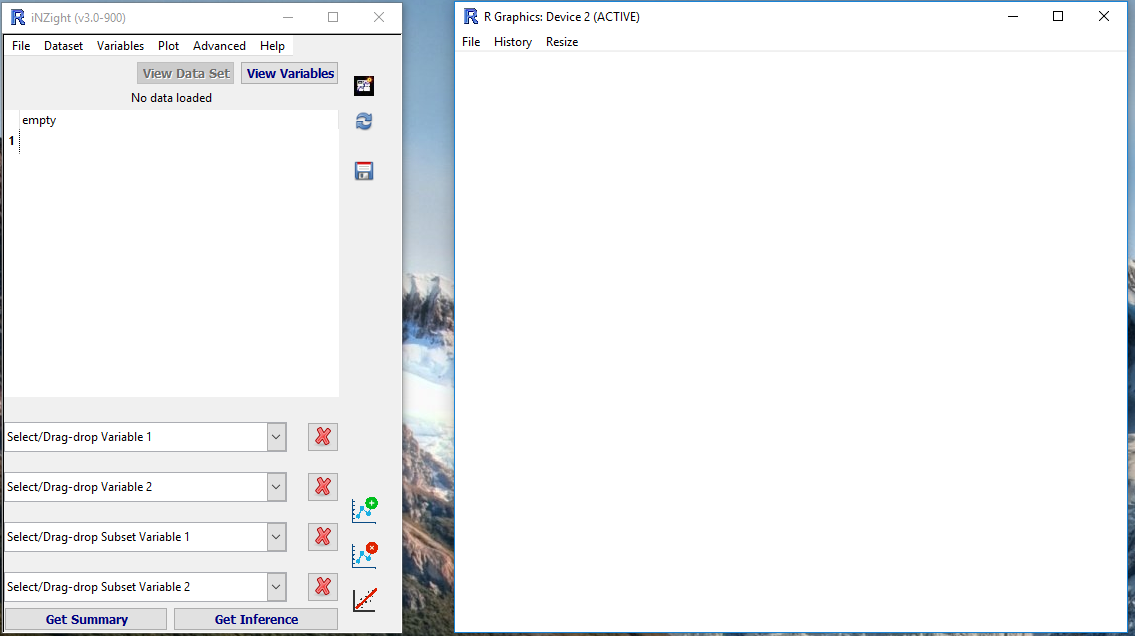
To switch between the two, go to File > Preferences, and check the box "Use dual-window display mode".
Colour Specification
In many of the Colour specification windows, you can either select from the menu, or type in a value of your own. Colours can specified by the name of any colour known by R, or alternatively by using hexadecimal (HEX) codes.
To specify a HEX code, you enter a hash "#" followed by 6 digits (numbers 0-9 and/or letters A-F). The 6-digit HEX code is divided into three 2-digit codes that specify red, green, and blue, respectively. 00 corresponds to 0%, and FF corresponds to 100%. Some examples are:
#000000= black#FFFFFF= white- #0000CC #009900 #FF0000 #c09040
Opacity
You can also specify opacity when using HEX codes. This is done simply by adding two additional digits (forming an 8-digit code), where 00 = 0% opacity = completely invisible.
Interactive Plots
iNZight can produce interactive versions of plots that you can explore in a web browser — hovering, clicking, and selecting data points.
Exporting interactive plots (Desktop)
This feature is still a work-in-progress. Please play around with it and let us know what you like, what doesn't work so well, and any other feedback you have!
There are two ways to get an interactive plot from iNZight Desktop:
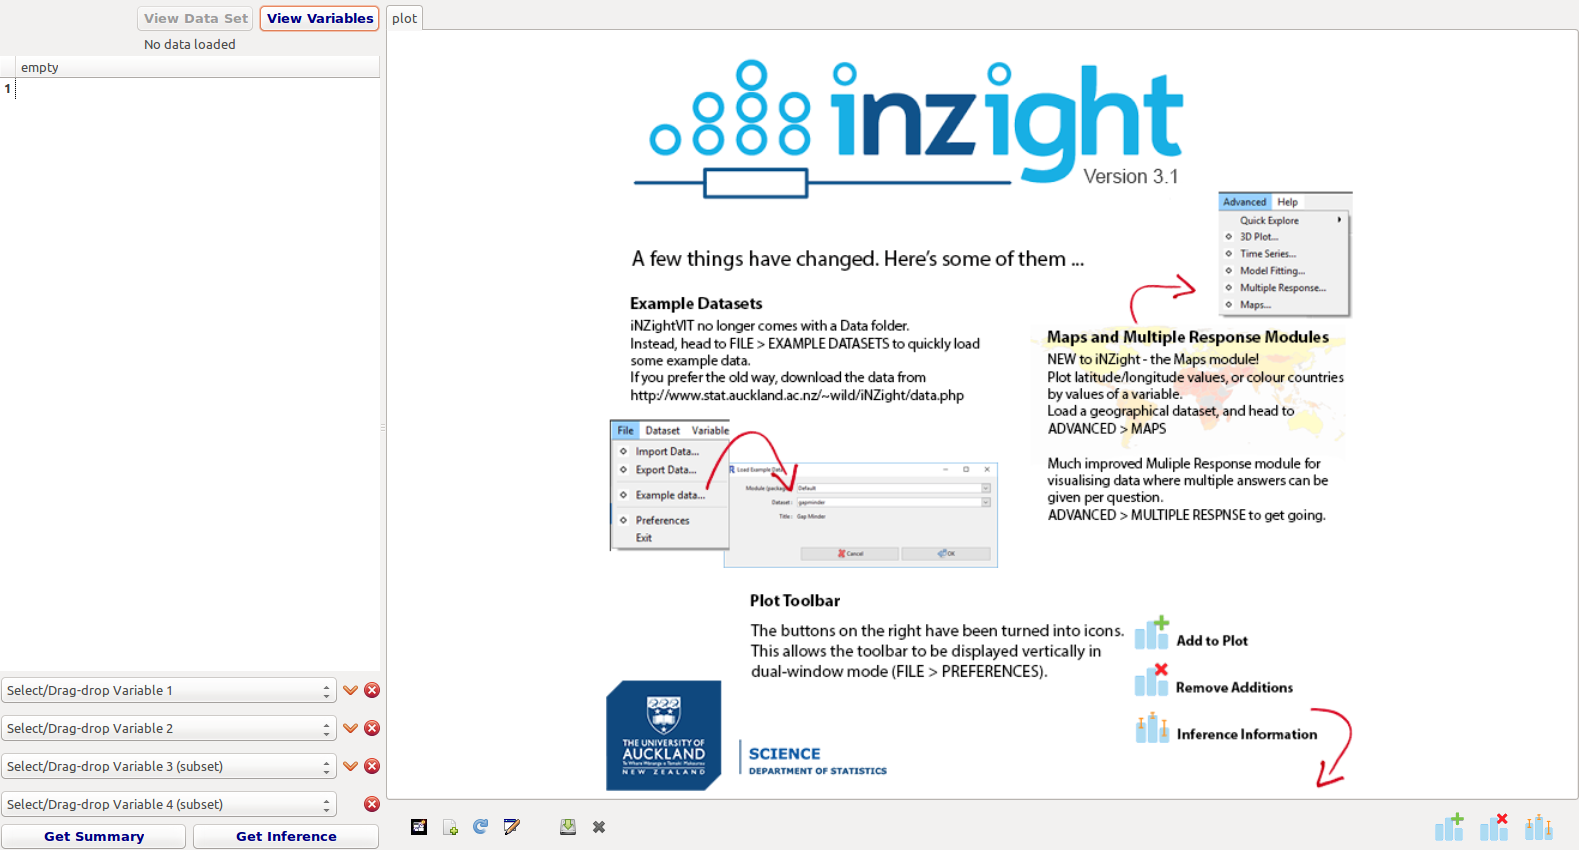
Toolbar button
Most single-panel plots have an interactive version. Look for the interactive icon in the plot toolbar — a blue icon means one is available, a grey icon means it is not.
Clicking the icon opens the interactive plot directly in your default web browser.
Save dialog
You can also export via Save Plot (the save icon on the toolbar, or Plot menu):
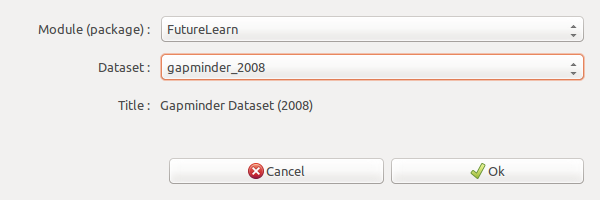
Let's load the gapminder-2008 data from the FutureLearn module:
File > Example Data and select the Gapminder 2008 dataset:
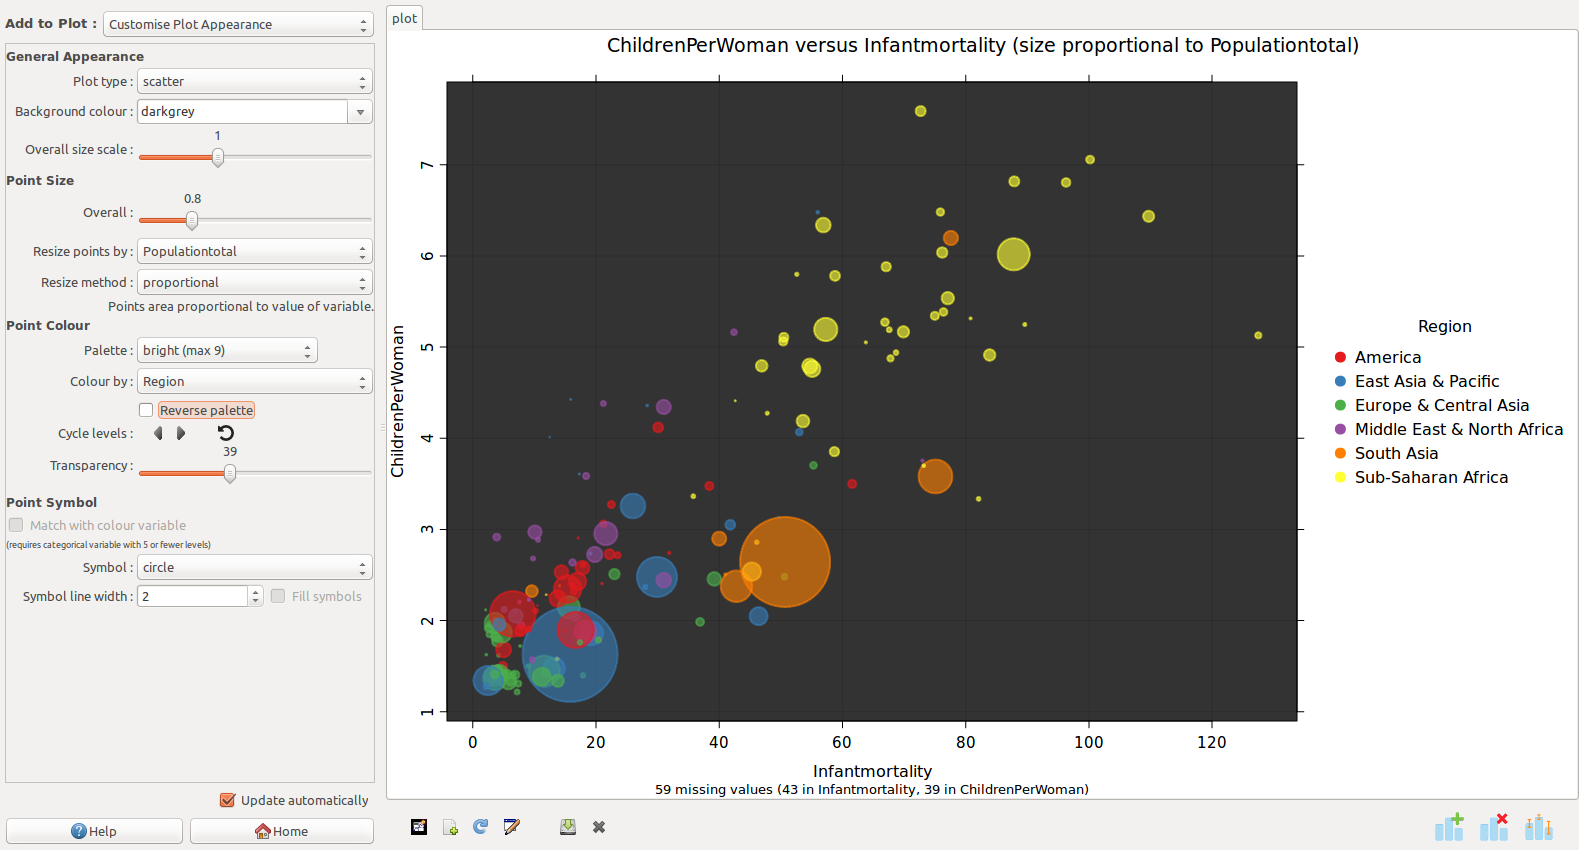
Now plot some variables. Here we're using ChildrenPerWoman and Infantmortality, coloured by Region and sized by Populationtotal, but you can use whichever you prefer.
Now click the "Save" icon in the plot toolbar, or from the Plot menu.
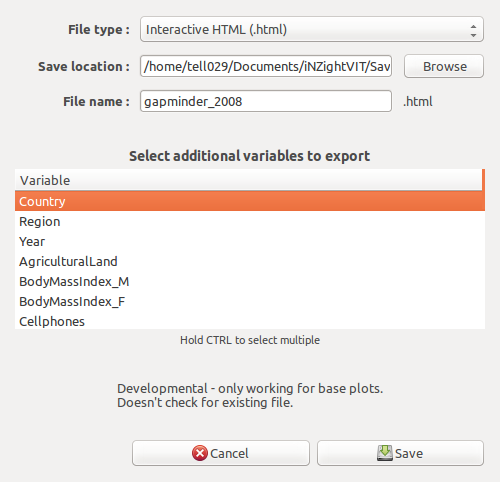
- File type: choose "Interactive HTML" (or "SVG" for a static vector image)
- Save location: You can leave this as default, which is the iNZightVIT/Saved Plots folder in your Documents.
- File name: choose something appropriate
- Additional variable: We've selected "Country" as an additional variable to export, so we can use it to label points.
Once you click save, you might be prompted to install additional packages. Click "Yes" and wait while that happens, then you can save again.
ggplot2 plot types
When you are using one of the ggplot2-based plot types, the Add to Plot panel includes an "Interactive Plot (via plotly)" button that opens the current plot as a plotly widget in your browser. This is available for most gg plot types except pie, donut, gridplot, barcode, and ridgeline.
Interacting with plots
Once you have an interactive plot open:
- Hover your mouse over points to see details about that observation
- Click points to add to selection, and "View Table" to see the rows of the data set for those observations
- Click-and-drag to select a region of points
- Click a legend label to highlight points in that group
Supported plot types
Interactive export works with most single-panel iNZight plots, including scatter plots, dot plots, bar charts, and hexagonal binning plots. Panel (faceted) plots are not currently supported, and coloured hexagonal binning plots are not available as interactive versions.
Interactive HTML export requires the gridSVG, jsonlite, and knitr packages. SVG export requires gridSVG. If they are not installed, iNZight will prompt you to install them when you first try to export.
Code History
iNZight tracks the R code behind your actions. You can view and copy this code from the Code History panel. In the Model Fitting module, use the toolbar buttons to save and view code for individual models and plots.