Where to find help:
Download Now
- Latest Version:
- 4.4.0 (what's new?)
- Release Date:
- 08 April 2024
- Price:
- 100% Free!
Returning users:
Check out the transition guide
for help navigating the changes in the latest version of iNZight!
On a mac or tablet? Try our online version:
inzight Lite
See inzight in action below ...
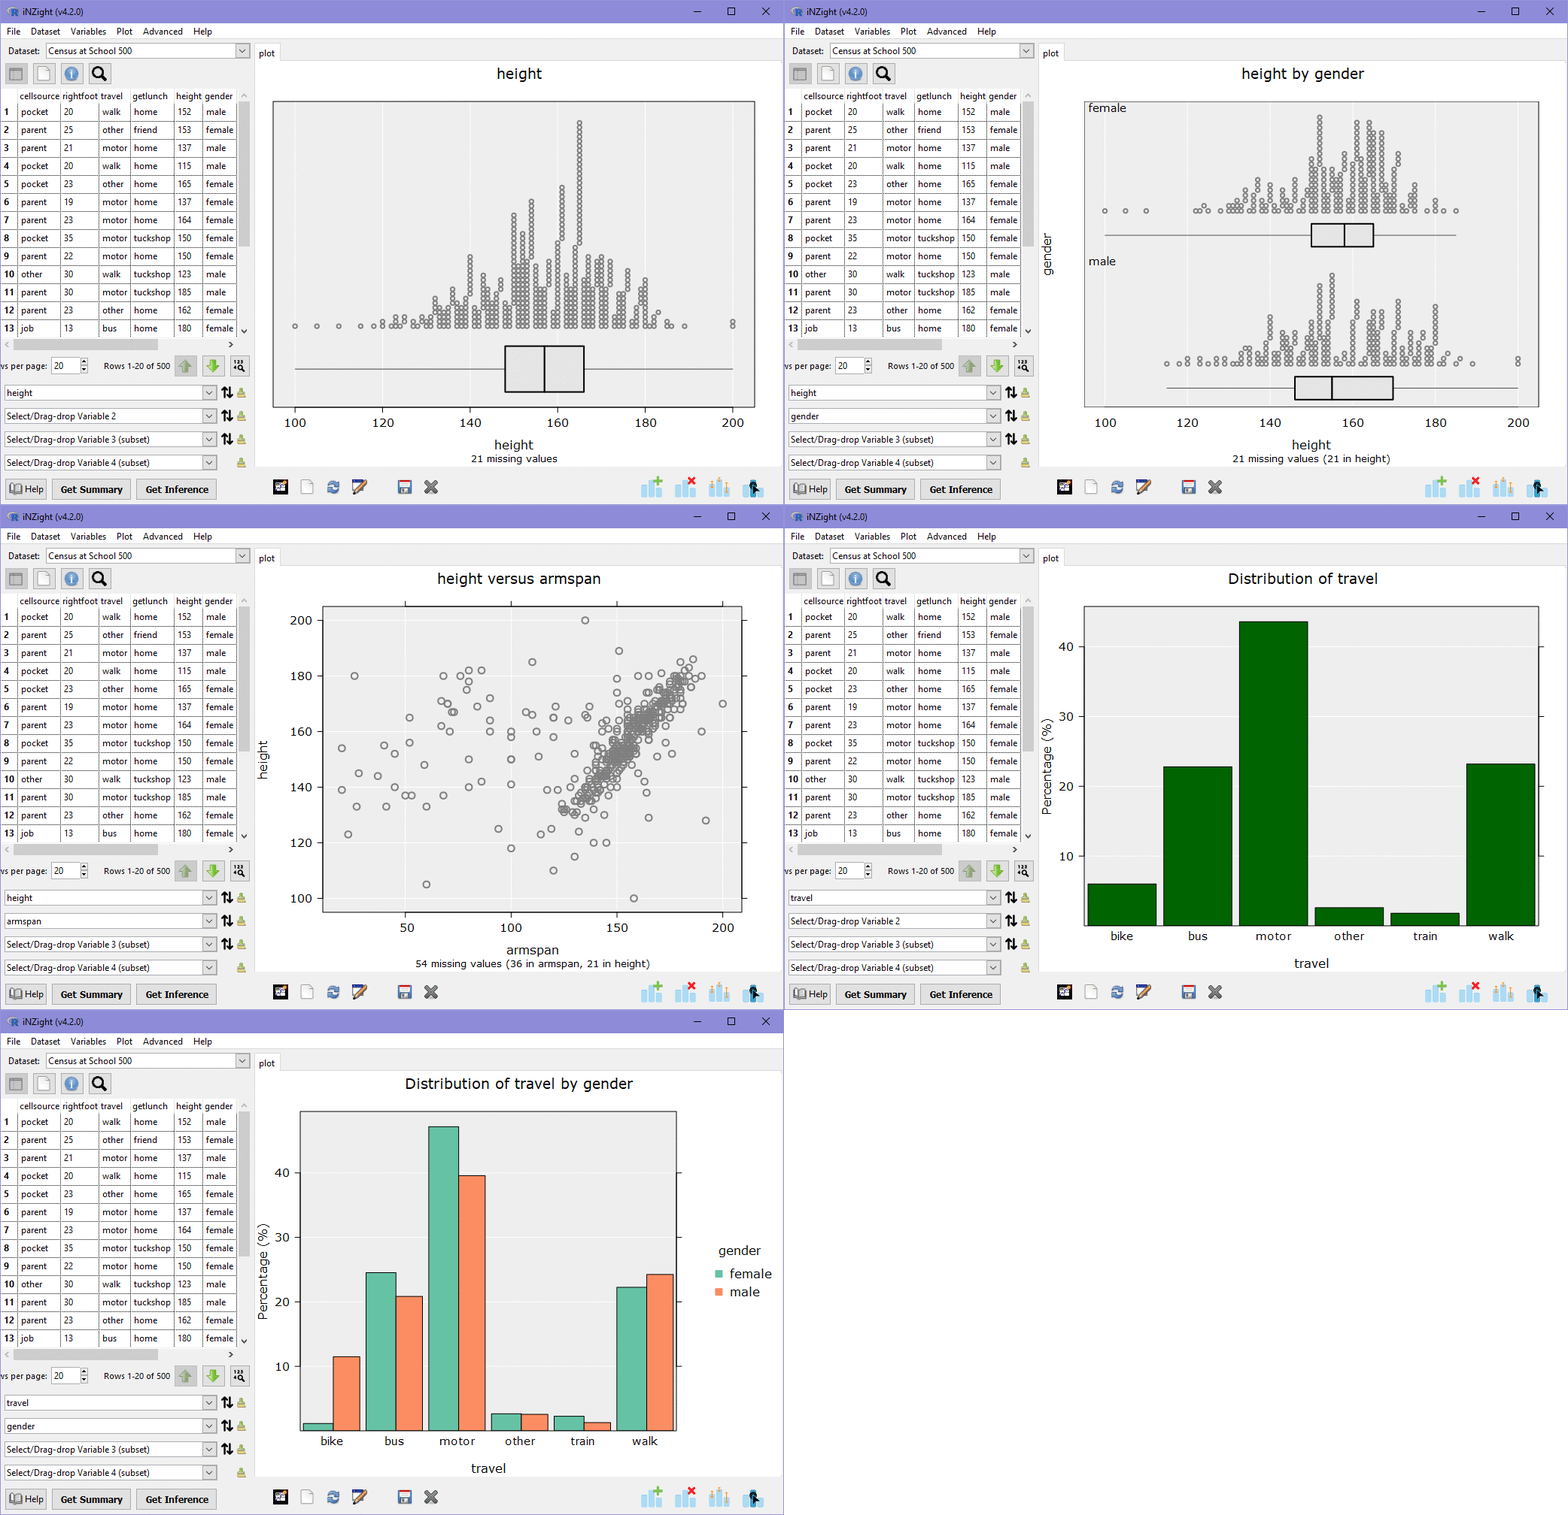
inzight intelligently draws the appropriate graph depending on the variables you choose
The quick drag-and-drop interface makes it easy to create graphs of your data. inzight automatically detects the variable type as either numeric or categorical, and draws a dot plot, scatter plot, or bar chart.
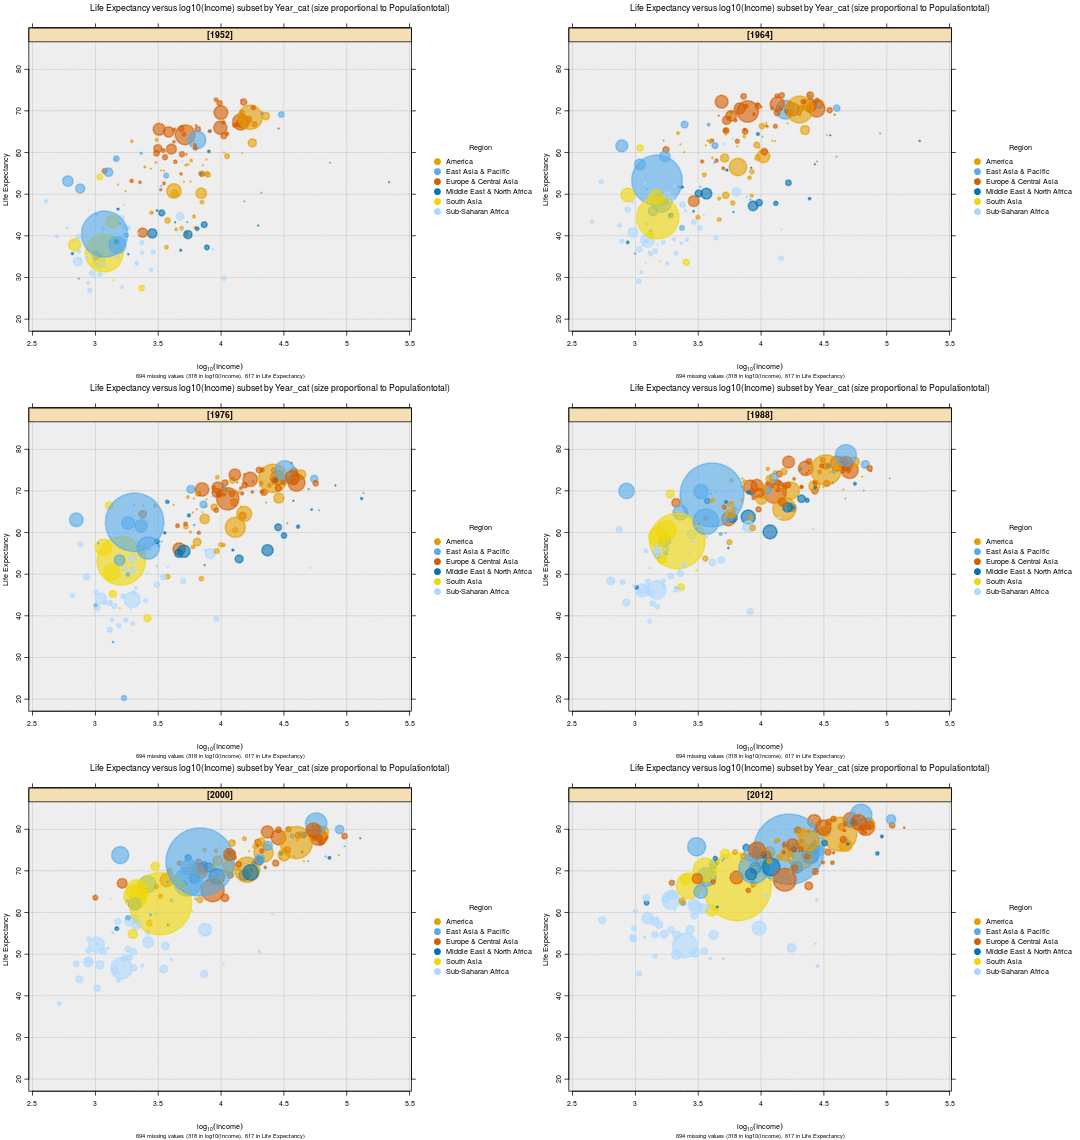
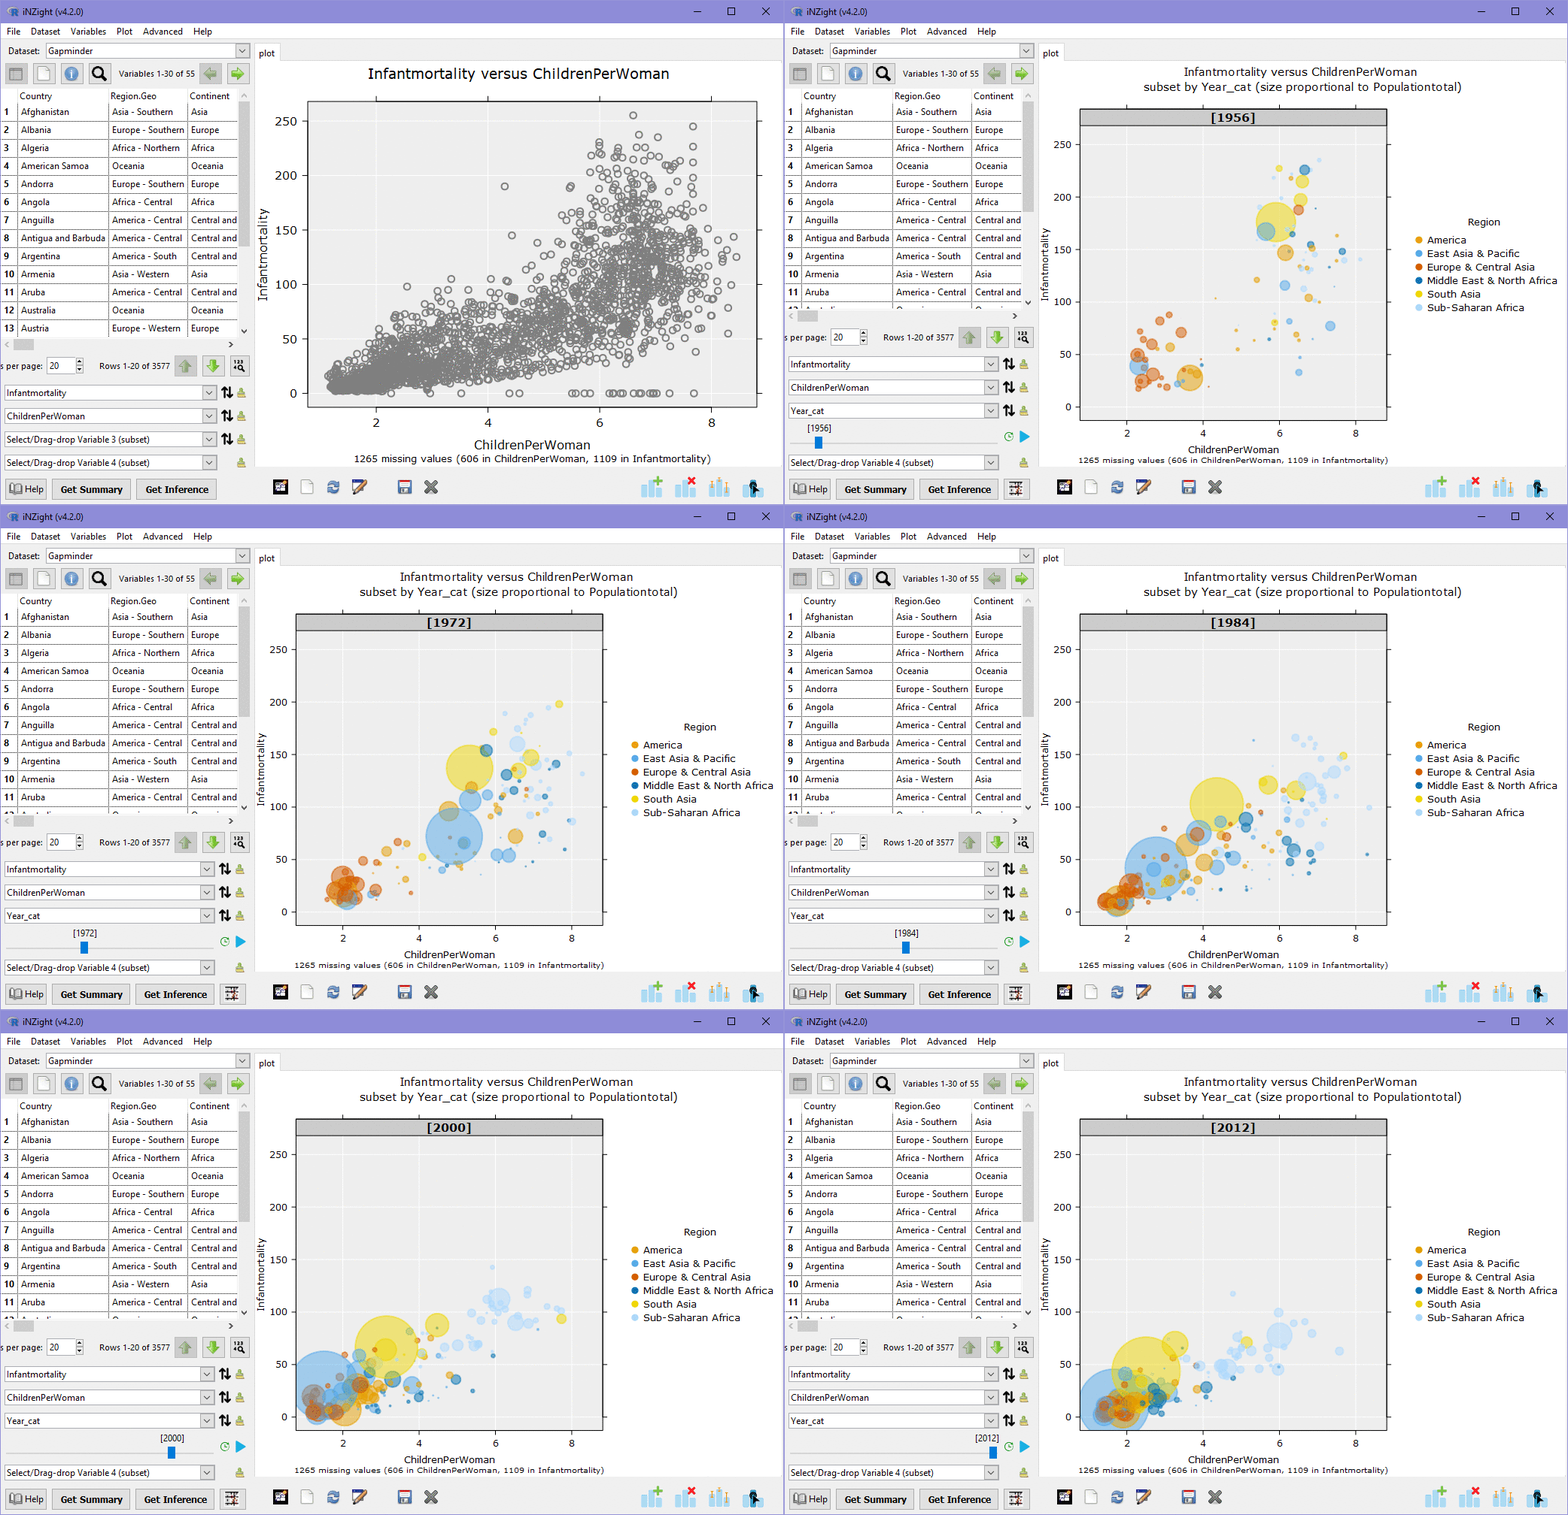
Discover trends by subsetting or adding colour to your plots
Two subsetting slots allow you to quickly detect trends or relationships between categories of a factor variable. Colour, sizing, and many other features, can be added through the Add to Plot interface.
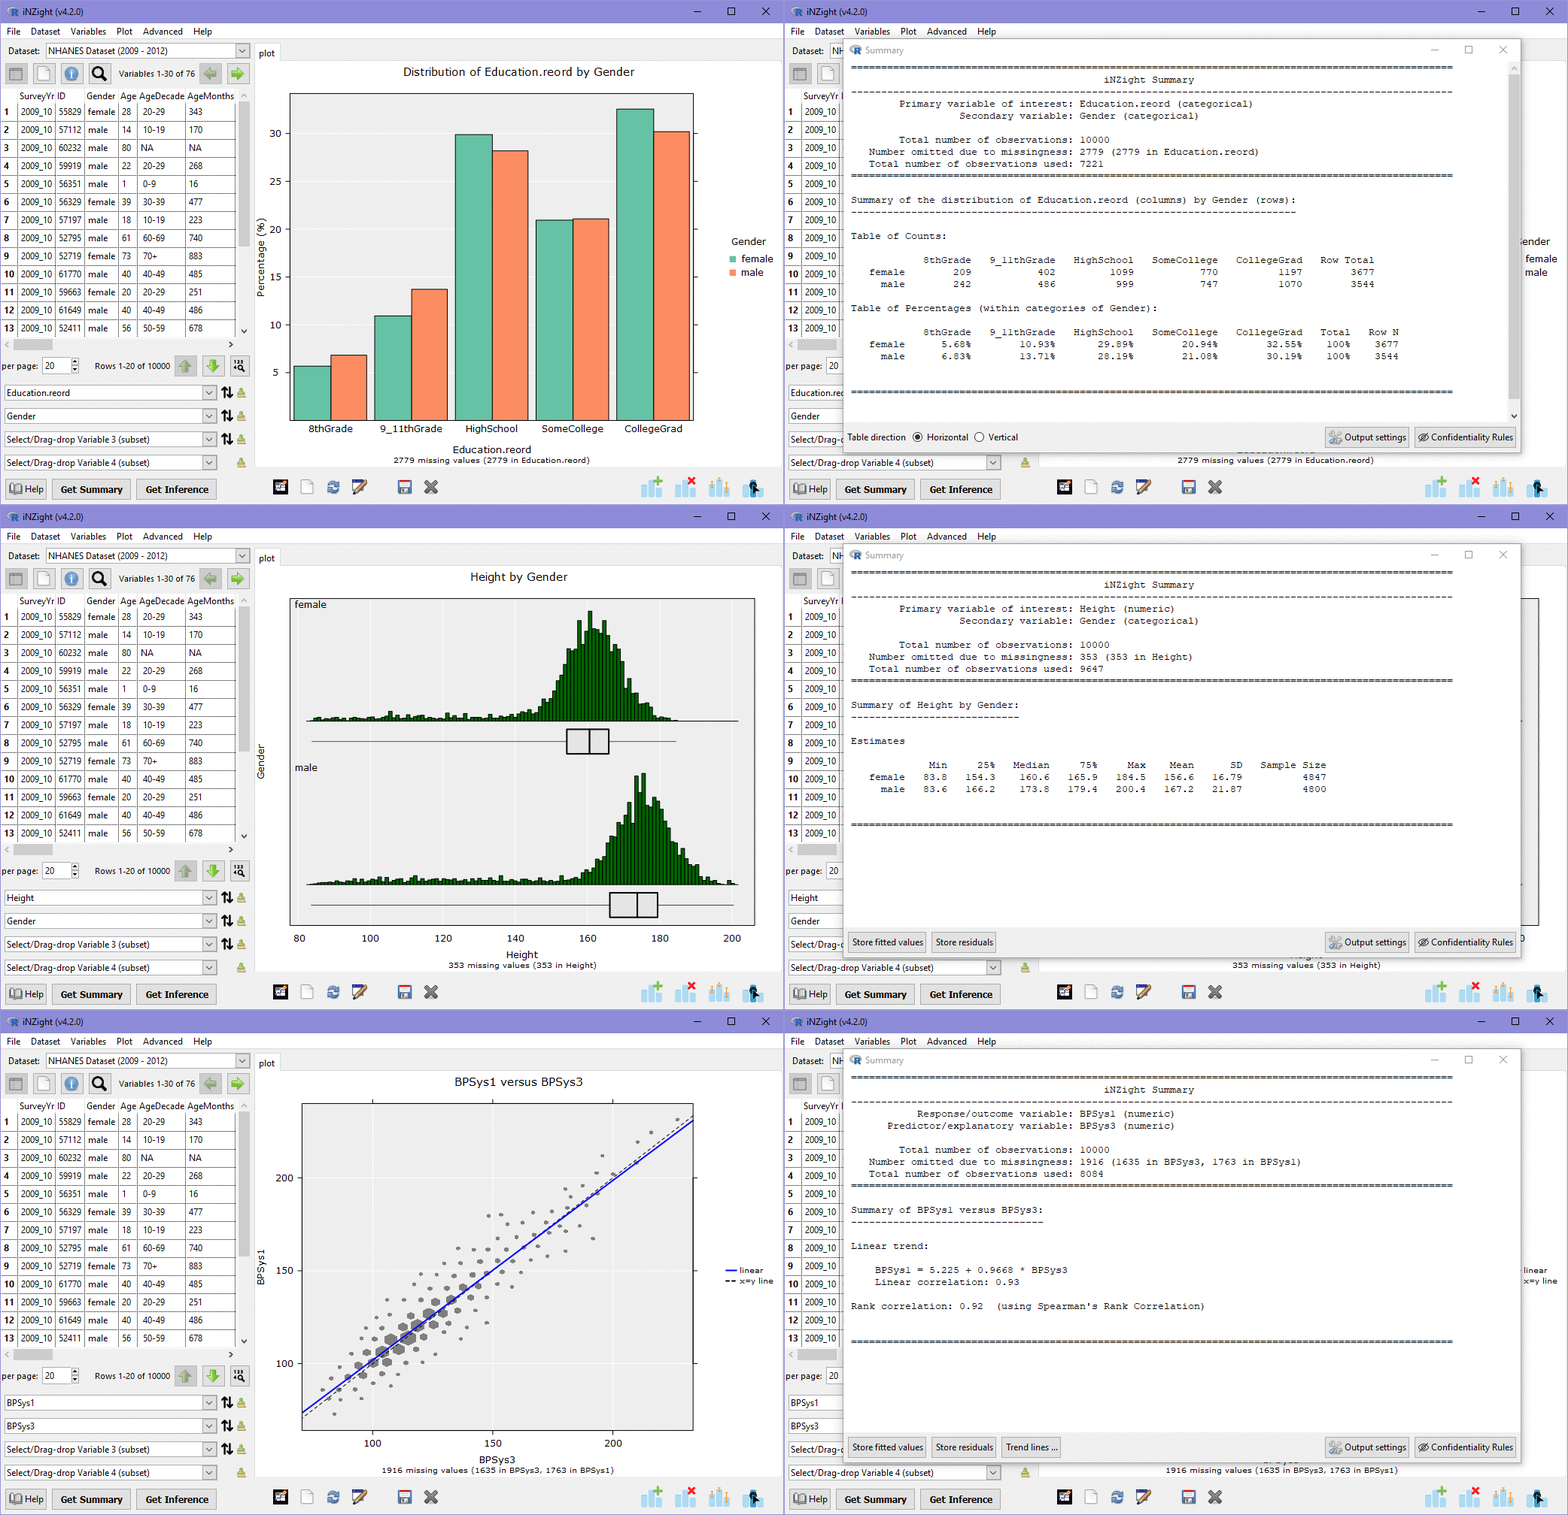
Numerical summaries available at the click of a button
As with the smart plots, the Get Summary and Get Inference buttons quickly provide numerical summaries relating to the displayed plot. Tables of counts for categorical data; means, medians and variance for numerical; and regression summaries for fitted trend lines.
